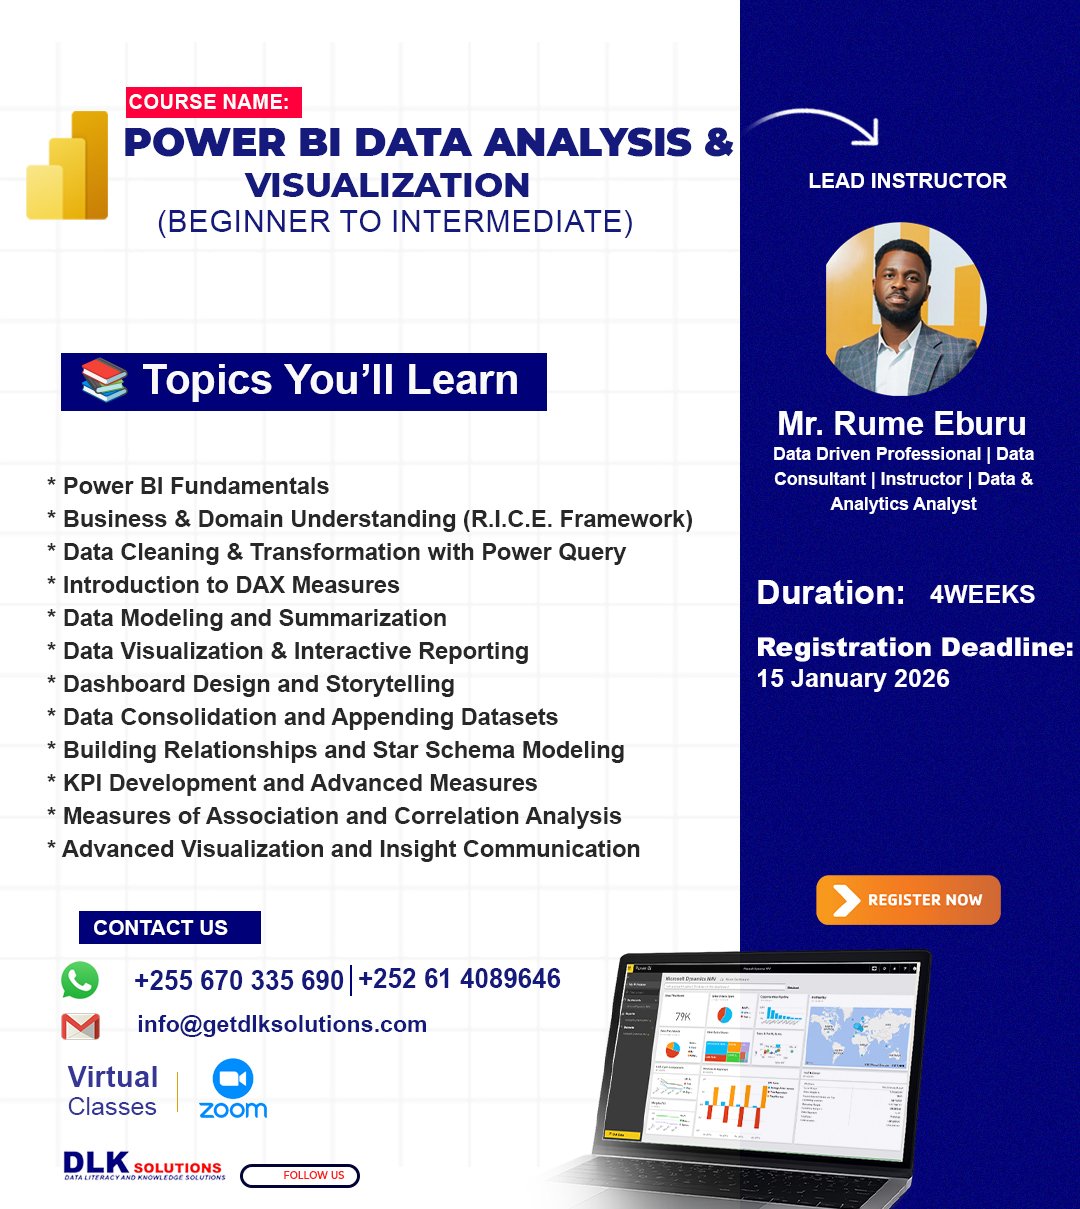
Power BI Data Analysis & Visualization
Course Overview
This Course focuses strictly on Power BI as a data analysis and visualization tool. It is designed to build strong, practical Power BI skills from beginner to intermediate level through hands-on learning, replication, and real-world datasets. The emphasis is on using Power BI to connect data, clean data, model data, analyze data, and build dashboards that answer real business and institutional questions, particularly within health-related contexts.
Learning Outcomes
By the end of this course, learners will be able to:
- Navigate and confidently use Power BI Desktop
- Connect Power BI to different data sources
- Clean and transform data using Power Query
- Work with multiple datasets at the same time
- Write basic to intermediate DAX measures
- Design interactive dashboards and reports
- Replicate complete Power BI projects independently
- Collaborate effectively with fellow BI developers and data analysts
Program Structure
- Delivery Mode: 100% Virtual (Zoom)
- Duration: 4 Weeks
- Total Sessions: 8 Live Sessions
- Session Length: 2 Hours per session
- Class Size: 20–25 participants
- Schedule: Fridays & Tuesdays
- Time: 7:00 PM – 9:00 PM (EAT)
Teaching Approach
- 100% practical Power BI sessions via Zoom or Google Meet.
- WhatsApp group(s) for students collaboration and project submissions.
- Live demonstrations using Power BI Desktop
- Students replicate everything demonstrated by the instructor
- Weekly Power BI assignments
- Instructor support through a shared group channel
Register here
Need help?
Feel free contact us
Our mission is to empowers businesses off all size in an businesses.